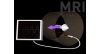
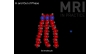
This animation supports Figures 8.35-8.38. It demonstrates entry slice phenomenon. It shows flowing spins in the aorta and IVC in four slices orientated perpendicular to the direction of flow. The slices are acquired in the order shown, i.e. the most inferior slice first and ending with the most superior slice. The flow in the aorta is, therefore, in the opposite direction to slice acquisition, whereas the flow in the IVC is in the same direction as slice acquisition.
Fresh spins in both the aorta and the IVC are ones that have traveled from somewhere else in body and "hit" one of the slices for the first time. This is when they receive their first RF excitation pulse. Because the direction of flow is different in the aorta than the IVC, this occurs in a different slice for each vessel. It occurs in the most superior slice for spins in the aorta, and the most inferior slice for spins in the IVC. When spins receive an RF pulse of the first time, they return a much higher signal than when they have received several RF pulses and become saturated.
This is shown in Figures 8.35 and 8.38. In Figure 8.35, high signal intensity is returned from the IVC because this is the most inferior slice in the stack. These spins are fresh, and therefore, return a higher signal than spins in the aorta that have become saturated because they have received several RF pulses as they passed down through the stack of slices from top to bottom.
In Figure 8.38, the effect is reversed. This is the most superior slice in the stack and therefore, the spins in the aorta are fresh and returning a high signal, whereas spins in the IVC are saturated because many have traveled through the stack from the bottom to the top. The other phenomena that is demonstrated in this animation is that as the flow in the IVC is in the same direction as slice excitation, spins become saturated faster than spins in the aorta that have traveled in the opposite direction to slice excitation. Therefore, the IVC returns a lower signal on Figure 8.38, then the aorta returns in Figure 8.35.
 Animation 1.1 Rotating and Fixed Frame of Reference
09/05/2023
Animation 1.1 Rotating and Fixed Frame of Reference
09/05/2023
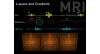
 Animation 1.2 (NMV and Coil)
09/05/2023
Animation 1.2 (NMV and Coil)
09/05/2023
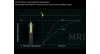
 Animation 1.3 (NMV Coil and Oscilloscope)
09/05/2023
Animation 1.3 (NMV Coil and Oscilloscope)
09/05/2023
 Animation 2.1 (T1 vs T2)
09/05/2023
Animation 2.1 (T1 vs T2)
09/05/2023
 Animation 2.2 (Diffusion)
09/05/2023
Animation 2.2 (Diffusion)
09/05/2023
 Animation 3.1 (The 180° RF Pulse)
09/05/2023
Animation 3.1 (The 180° RF Pulse)
09/05/2023
 Animation 3.2 (The Larmor Grand Prix)
09/05/2023
Animation 3.2 (The Larmor Grand Prix)
09/05/2023
 Animation 3.3 Inversion Recovery
09/05/2023
Animation 3.3 Inversion Recovery
09/05/2023
 Animation 6.1 (Slices Chest of Drawers)
09/05/2023
Animation 6.1 (Slices Chest of Drawers)
09/05/2023
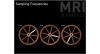 Animation 6.2. (Sampling Frequencies)
09/05/2023
Animation 6.2. (Sampling Frequencies)
09/05/2023
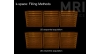 Animation 6.3 (Filling Methods)
09/05/2023
Animation 6.3 (Filling Methods)
09/05/2023
 Animation 8.1 (In and Out of Phase)
09/05/2023
Animation 8.1 (In and Out of Phase)
09/05/2023
 Animation 8.2 (Entry-slice Phenomenon)
09/05/2023
Animation 8.2 (Entry-slice Phenomenon)
09/05/2023
 Animation 8.3 Time of Flight
09/05/2023
Animation 8.3 Time of Flight
09/05/2023
 Animation 8.4 (Gradient Moment Nulling)
09/05/2023
Animation 8.4 (Gradient Moment Nulling)
09/05/2023
 Animation 9.1 (Closed and Open Systems)
09/05/2023
Animation 9.1 (Closed and Open Systems)
09/05/2023
 Animation 9.2 (Active Shielding)
09/05/2023
Animation 9.2 (Active Shielding)
09/05/2023
 Animation 9.3 (NMV Coil and Scanner Loop)
09/05/2023
Animation 9.3 (NMV Coil and Scanner Loop)
09/05/2023